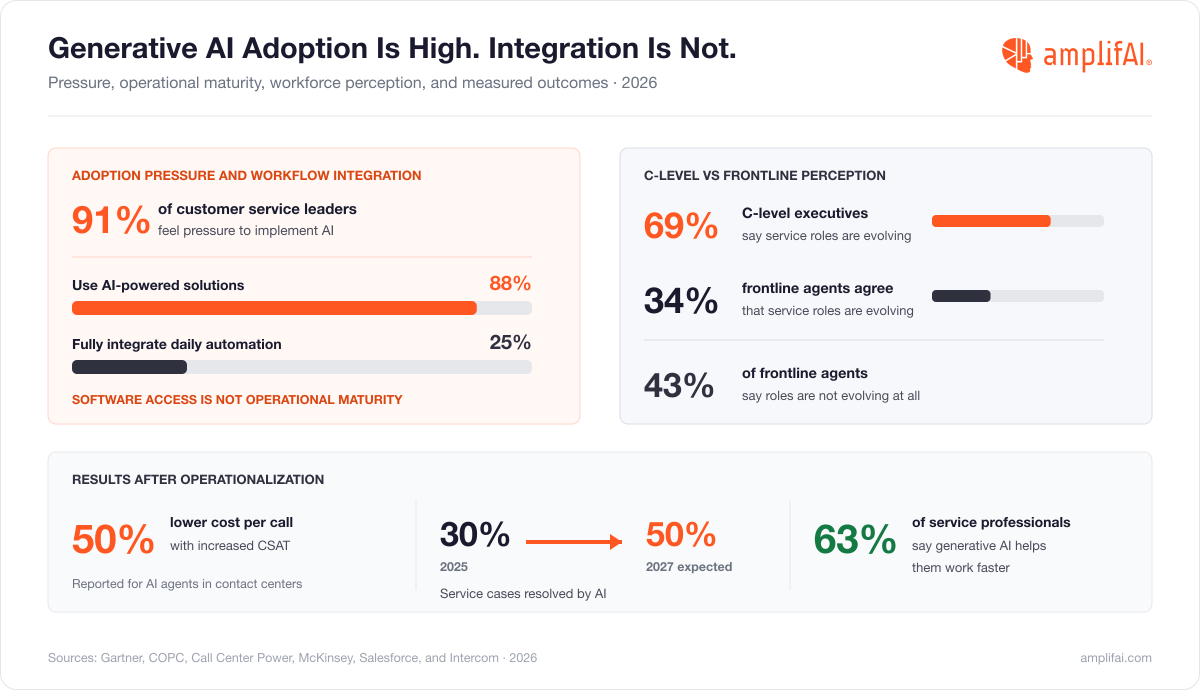
The latest customer service statistics in 2026 show AI adoption reaching scale before integrations into daily customer service and support workflows, with 91% of customer service leaders under pressure to implement AI (77) and 88% of contact centers using AI-powered solutions (79), while only 25% of call centers have fully integrated automation into daily workflows (80).
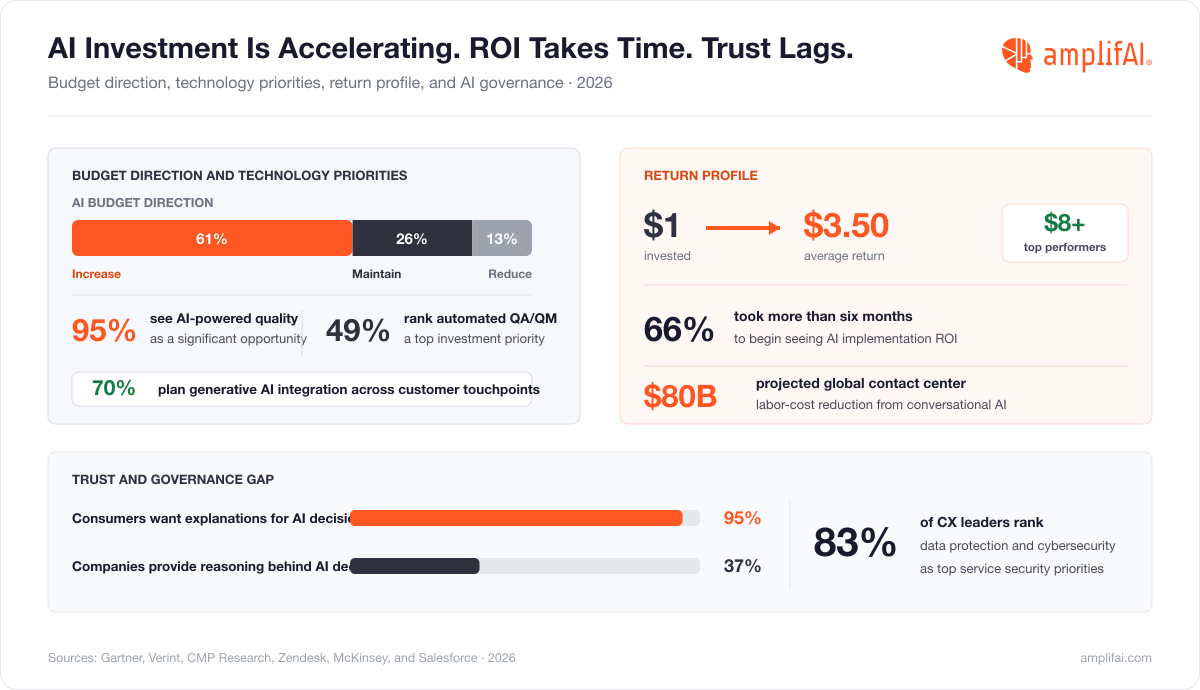
AI investment in customer service and support continues in 2026 , as 61% of contact center leaders plan higher AI spending (66), 70% of CX leaders target generative AI integration across customer touch-points within the next two years (71), yet 66% of contact centers took more than six months to start seeing ROI from their AI implementations (68).
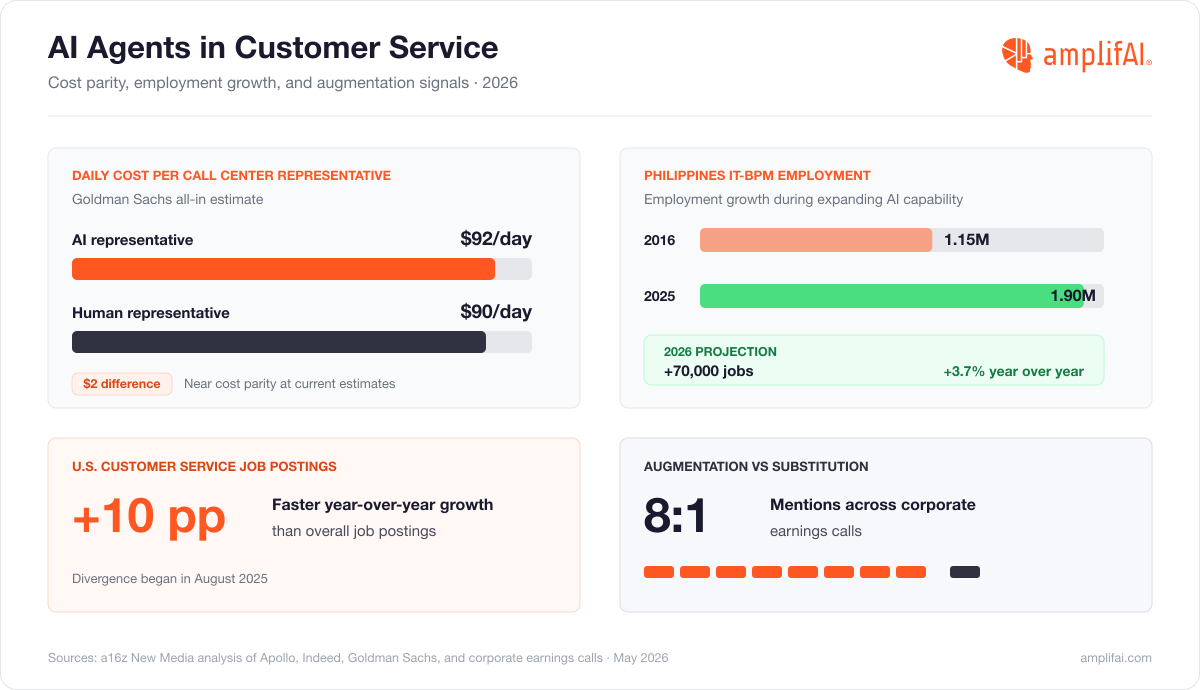
AI economics in customer service are weakening the original labor arbitrage and workforce displacement thesis, with Goldman Sachs estimating an all-in daily cost of $92 for an AI customer service center representative compared to $90 for a human representative (139), showing that AI agents have not yet delivered the expected labor-cost advantage over human counterparts in customer service and support roles. Workforce evidence points toward augmentation, as U.S. customer service job postings outpacing overall job postings by approximately 10 percentage points (138) while corporate earnings calls mentioned AI augmentation over eight times more often than substitution (140).
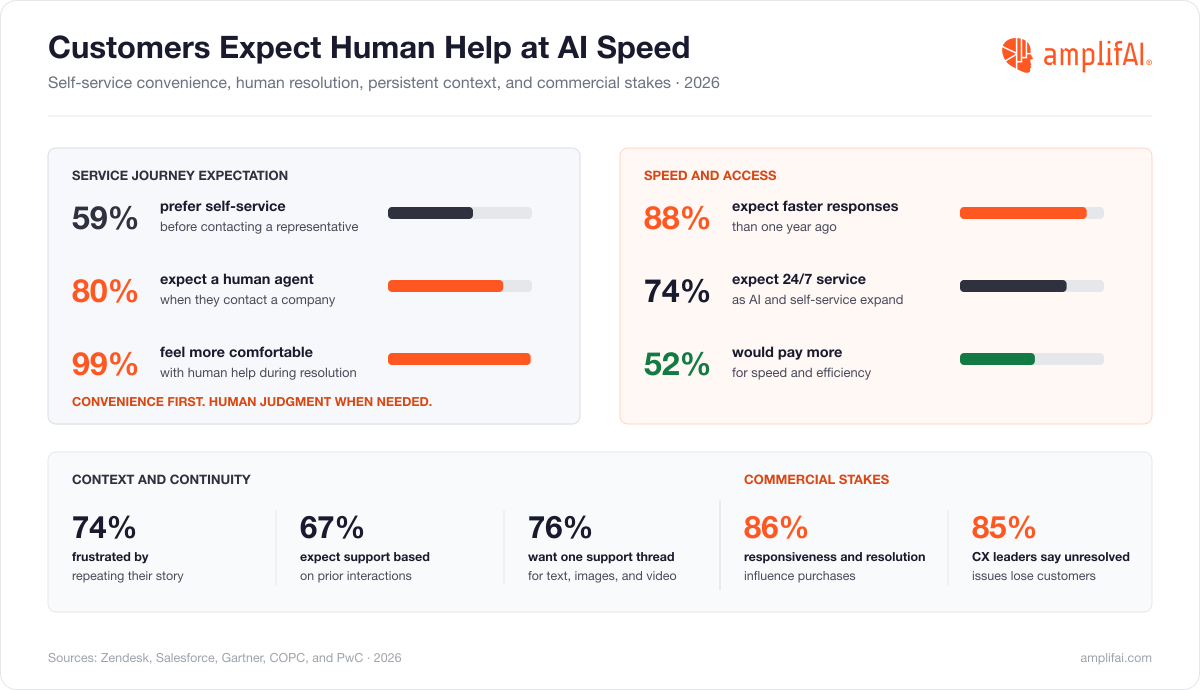
Your customers still expect human resolution at AI speed, with 99% feeling more comfortable with human assistance (14) and 80% expecting a person after making contact (9), while 88% expect faster responses (2) and 74% require 24/7 availability (3).
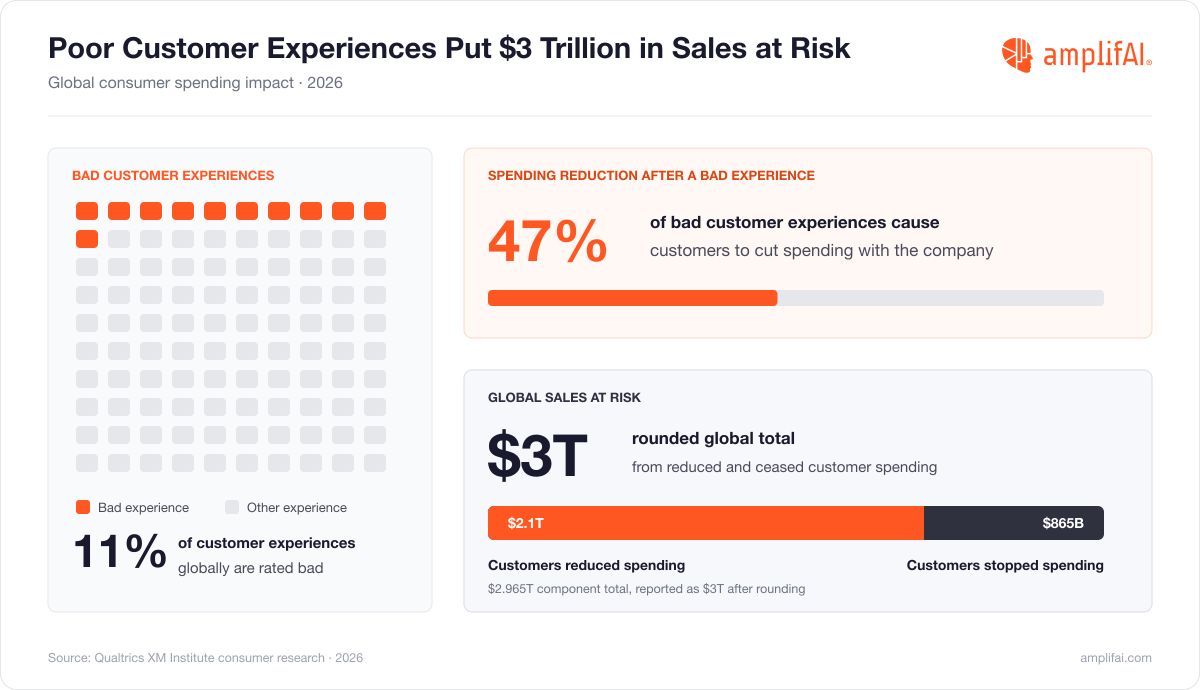
Customer-service returns now depend on delivering human resolution, speed, and availability together as poor customer experiences place $3 trillion in global sales at risk (20) while 59% of consumers say customer experiences are moving in the wrong direction (106).
Customer service statistics in 2026 show agentic AI access becoming a baseline while competitive advantage now depends on how well CX leaders integrate AI into frontline workflows, give human agents connected customer context, and measure changes in service quality.
Use the customer service statistics in this report to benchmark your AI strategy, workforce planning, customer expectations, channel performance quality assurance, and service investment priorities aginst current market evidence.
AmplifAI’s call center KPI benchmarks by industry is a great companion guide to the latest customer service statistics you need to know in 2026 with CMP Research median comparisons across customer experience, resolution, cost, self-service, workforce, and frontline satisfaction.
Customer Service Statistics on Customer Expectations
Customer service statistics on customer expectations show speed and first contact resolution becoming service baselines, with 88% of customers expecting faster response times than last year (2) while 85% of CX leaders say customers will leave a brand over a single unresolved issue (13). Context now separates contact centers, with 74% of consumers frustrated by repeating their story to different agents (10), 67% expecting support tailored to prior interactions (11), and 76% choosing companies that preserve text, images, and video within one support thread (17).
Customer Service Statistics on Customer Expectations
Customer service statistics on customer expectations in 2026
Stat #
Customer Service Statistics on Customer Expectations
Customer expectations rank across five areas: speed of response (63%), speed of resolution (57%), availability (49%), knowledge and expertise (49%), and politeness and empathy (43%).
Cite source
83% of CX leaders say memory-rich AI agents are the key to truly personalized customer journeys.
Cite source
Customer expectations statistics sourced from Zendesk CX Trends 2026, Salesforce, McKinsey, Gartner, COPC, Intercom, and PwC. For data on the cost of failing to meet these expectations, see Customer Service Statistics on Poor Customer Experiences below.
AmplifAI's Analysis on Customer Service Expectations
Customer expectations are additive rather than substitutive, with self-service expanding access (6) while human assistance remains central once customers make contact (9, 14). AI-enabled availability raises speed and 24/7 service baselines without reducing demand for empathy, judgment, or continuity, making context preservation across automated and human interactions central to customer experience (2, 3, 10, 11). Commercial value follows operational delivery, with 52% of consumers willing to pay more for greater speed and efficiency (18).
Meeting additive customer expectations requires performance enablement across human and automated service, with the best AI-powered call center performance management software connecting interaction data, quality scores, coaching priorities, and frontline execution through quality management, coaching workflows, role-based visibility, and performance measurement.
Customer Service Statistics on Poor Customer Experiences
Customer service statistics on poor customer experiences quantify bad-interaction costs in 2026, with $3 trillion in global sales at risk (20), 47% of consumers cutting spending after a negative experience (21), and 73% switching to a competitor after multiple failures (24). Most dissatisfied customers leave silently, with 56% walking away without filing a complaint (25).
Customer Service Statistics on Poor Customer Experiences
Customer service statistics on poor customer experiences in 2026
Stat #
Customer Service Statistics on Poor Customer Experiences
Poor customer experiences put $3 trillion in global sales at risk in 2026, with consumers cutting back $2.1 trillion and ceasing spending entirely on another $865 billion.
Cite source
17% of dissatisfied customers share their negative experience to raise awareness, and unhappy consumers tell twice as many people about bad experiences as satisfied customers tell about good ones.
Cite source
4 in 10 agents say that when customers can't complete tasks on their own, they become noticeably angry by the time they reach a representative.
Cite source
Poor customer experience statistics sourced from Qualtrics XM Institute, Zendesk CX Trends 2026, PwC, Salesforce, Coveo, and the National Customer Rage Study. For data on the revenue impact of positive customer experiences, see Customer Service Statistics on Positive Customer Experiences below.
AmplifAI's Analysis on Poor Customer Experiences
Complaint volume understates customer-service failure, with most dissatisfied customers leaving without escalation while negative experiences reduce spending before churn becomes visible in retention data (22, 25). Service breakdowns also begin upstream from frontline conversations, with company service design and agent access to customer information shaping resolution quality before recovery becomes necessary (29, 30).
To detect and prevent silent churn CX leaders need customer intelligence data that reaches beyond standard VOC complaint forms, and survey data. AmplifAI's best customer insights software of 2026 guide compares vendors with the AI capabilities to connect interaction data, survey responses, VOC, customer behavior, and service outcomes across customer journeys.
Customer Service Statistics on Positive Customer Experiences
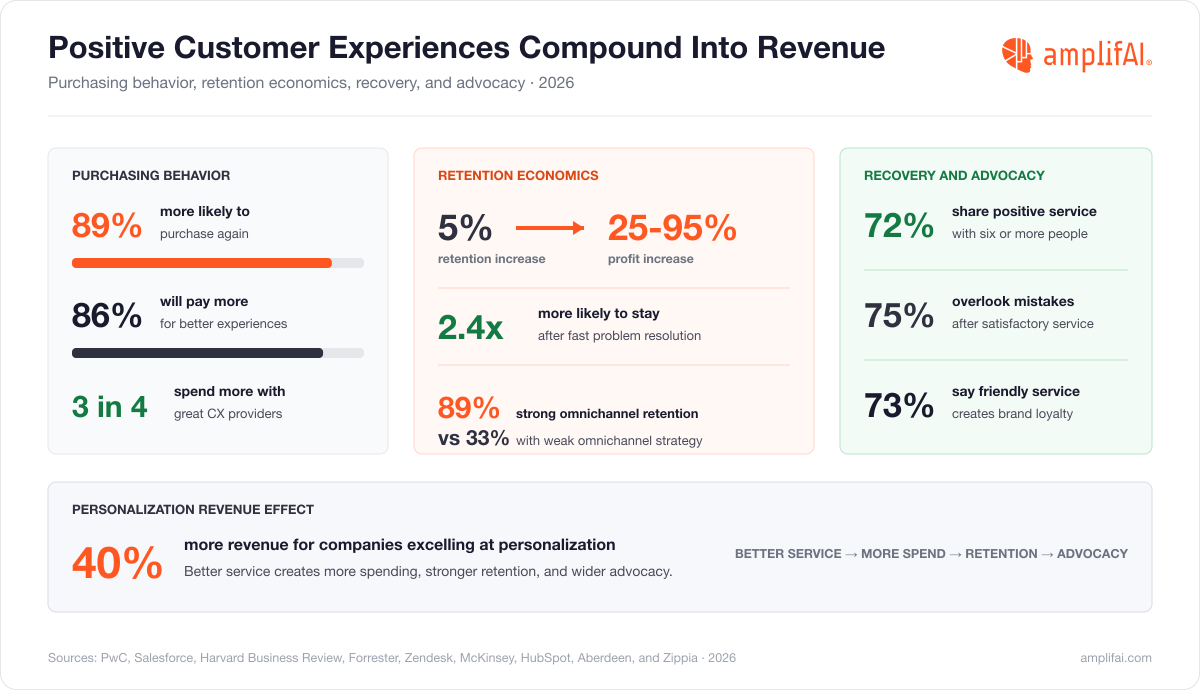
Customer service statistics on positive customer experiences show good service compounding beyond retention into revenue, with 89% of customers more likely to purchase again after a positive interaction (33) while companies excelling at personalization generate 40% more revenue (39). Retention economics amplify customer experience value, with a 5% retention increase producing 25% to 95% profit growth (34) while fast problem resolution makes customers 2.4x more likely to stay (37).
Customer Service Statistics on Positive Customer Experiences
Customer service statistics on positive customer experiences in 2026
Stat #
Customer Service Statistics on Positive Customer Experiences
75% of customers will overlook a company's mistakes after receiving satisfactory customer service, a pattern known as the service recovery paradox.
Cite source
Companies with strong omnichannel engagement retain 89% of their customers, compared to 33% for companies with weak omnichannel strategies.
Cite source
Positive customer experience statistics sourced from PwC, Salesforce, Bain & Company, Forrester, Zendesk CX Trends 2026, McKinsey, HubSpot, Aberdeen Group, and Zippia. For data on agent experience and workforce impact, see Customer Service Statistics on Agent Experience below.
AmplifAI's Analysis on Positive Customer Experiences
Positive customer experience creates compounding value when service quality remains consistent across routine support, fast resolution, and recovery, with repeat purchases, retention, and advocacy reinforcing one another rather than operating as separate outcomes (33, 34, 36, 40). Revenue growth depends on repeatable frontline performance rather than isolated moments of delight, making quality consistency and coaching effectiveness central to customer lifetime value (37, 42).
Turning positive customer service experiences into repeatable value requires coaching teams on the behaviors that drive those experiences. AmplifAI's best AI-powered call center coaching software guide compares how vendors leverage AI to support and enable team leaders through connecting interaction evidence, coaching priorities, agent behavior, and performance measurement.
Customer Service Statistics on Agent Experience
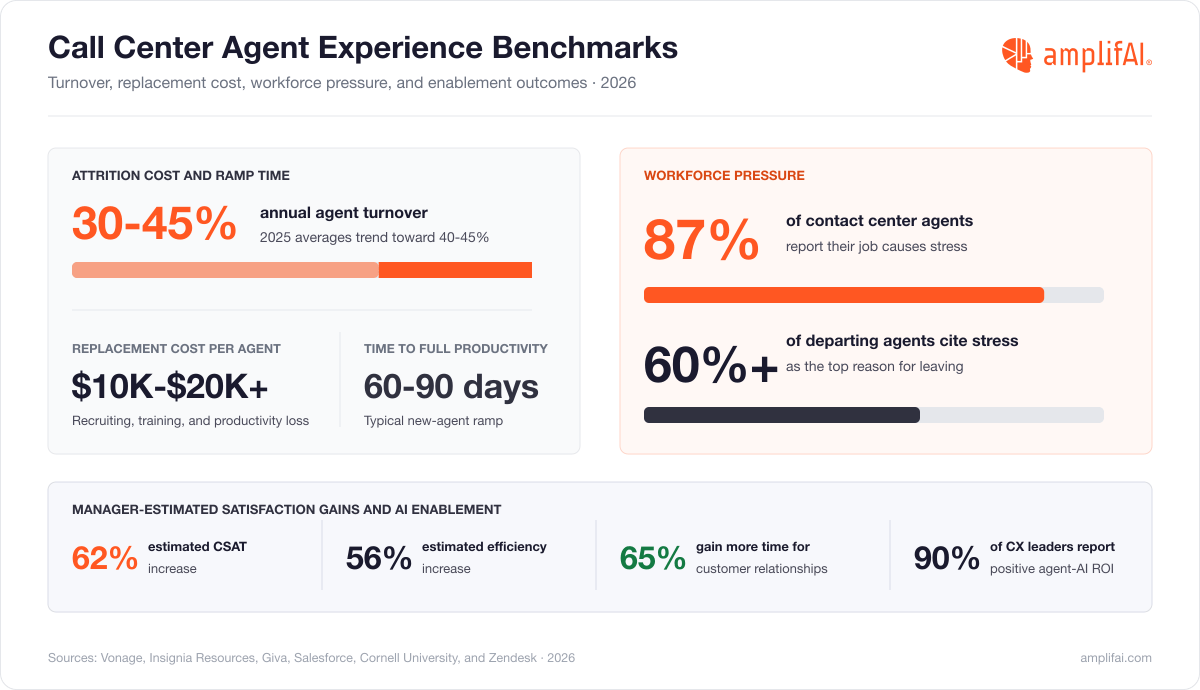
Customer service statistics on agent experience show workforce instability compounding service costs, with contact centers losing 30-45% of their workforce annually (44), replacement costs reaching $10,000 to $20,000 per agent (43), and 87% of agents reporting job-related stress (49). Agent satisfaction connects workforce and customer outcomes, with call center managers estimating potential CSAT increases of 62% and efficiency gains of 56% (47).
Customer Service Statistics on Agent Experience
Customer service statistics on agent experience in 2026
Contact centers experience 30-45% annual turnover, with 2025 averages closer to 40-45%, making agent attrition one of the most expensive operational challenges in customer service.
Cite source
Call center managers believe improving agent job satisfaction can increase CSAT by 62%, boost efficiency by 56%, and improve agent retention by 39%.
Cite source
90% of customers value experience as much as the product itself, making agent-delivered service quality a direct revenue driver.
Cite source
Agent experience statistics sourced from Vonage, Insignia Resources, Invoca, Salesforce, Cornell University, Zendesk CX Trends 2026, and SQM Group. For data on how CX leadership impacts agent performance, see Customer Service Statistics for CX Leadership below.
AmplifAI's Analysis on Agent Experience
Agent experience functions as a service-performance input rather than an isolated workforce metric, with stress and attrition compounding replacement cost, ramp time, and service inconsistency across frontline teams (43, 45, 46, 49). AI value emerges through agent enablement rather than workforce substitution, with additional relationship time and higher agent satisfaction connecting AI use to CSAT, efficiency, and retention outcomes (47, 48, 50).
AmplifAI's call center turnover guide maps key employee attrition drivers with the best call center gamification software comparison guide evaluating vendors on how they engage agents through connected goals, recognition, incentives, and deliver performance visibility across frontline teams.
Customer Service Statistics for CX Leadership
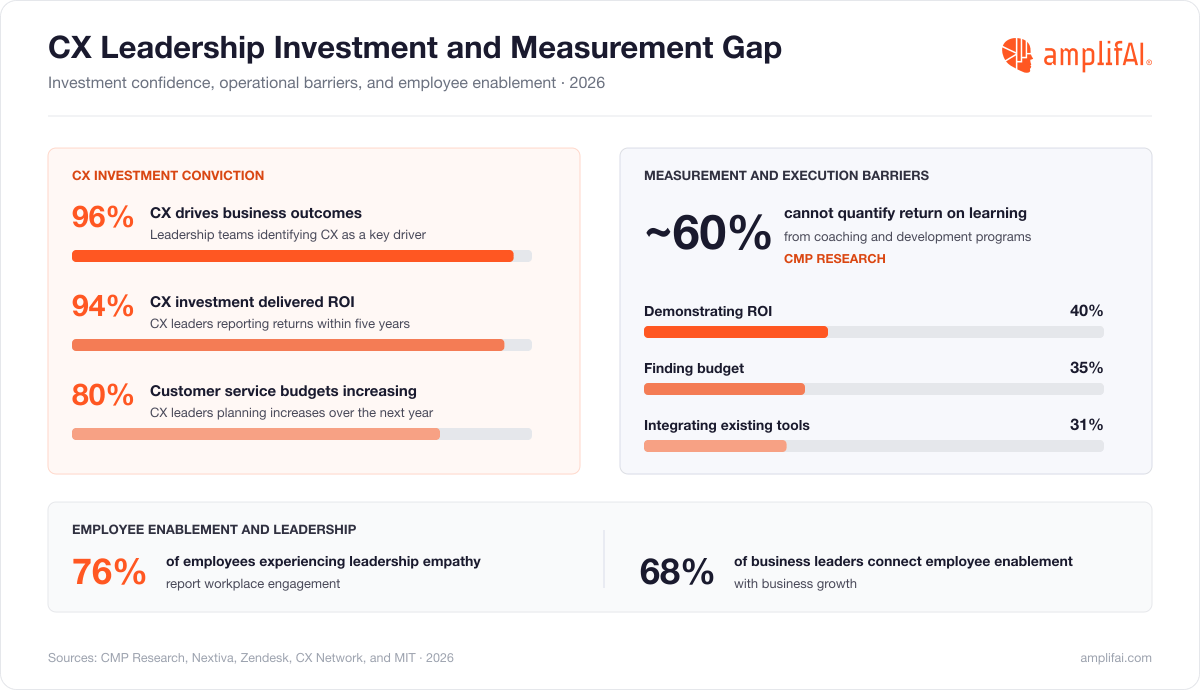
Customer service statistics for CX leadership show executive investment accelerating, with 96% of leadership teams viewing customer experience as a key business-outcome driver (58) and 80% planning customer service budget increases over the next year (59). Measurement remains a primary constraint, with 40% naming ROI demonstration as their largest investment obstacle (60) while nearly 60% cannot sufficiently quantify return on learning from coaching and development programs (57).
Customer Service Statistics for CX Leadership
Customer service statistics for CX leadership in 2026
42% of employees rate their company's emotional intelligence as low, while 35% rate it as high, exposing a leadership gap that directly affects agent engagement and retention.
Cite source
Nearly 60% of contact center leaders say they can't sufficiently quantify "return on learning" from coaching and development programs, according to the 2026 CMP Research Prism for Automated QA/QM.
Cite source
40% of CX leaders say demonstrating ROI is the biggest challenge to their investment priorities, ahead of finding budget (35%) and integration with existing tools (31%).
Cite source
Managing the change of an AI-augmented workforce and upskilling employees and supervisors are cited as important initiatives in CMP Research's 2026-27 Executive Priorities Report.
Cite source
CX leaders rank the top areas where support teams need improvement: eliminating manual or repetitive tasks (71%), improving customer experience (64%), improving support efficiency (55%), faster time to resolution (47%), and boosting agent morale (44%).
Cite source
Companies see a 10-15% increase in revenue by improving customer experience.
Cite source
CX leadership statistics sourced from CMP Research, Zendesk CX Trends 2026, Nextiva, CX Network, MIT, Forbes, Ultimate.ai, AmplifAI, and Zippia. For data on future CX technology investments, see Customer Service Statistics on Future AI Investments below.
AmplifAI's Analysis on CX Leadership
CX leadership performance depends less on investment conviction than measurement depth, with strong ROI confidence coexisting alongside limited proof at coaching-program and employee-development levels (57, 60, 61). Coaching, empathy, and employee enablement become measurable leadership responsibilities when performance systems connect management actions to agent behavior and customer outcomes (53, 54).
CX leaders are expected to make dramatic increases in the deployment of customer analytics software that not only displays dashboards with KPI's and customer insights, but connects those insights to role specific actions. AmplifAI's best AI-powered call center analytics software guide compares the vendors capable of unifying interaction, performance, customer, QA, survey, and workforce data and feeding those insights into coaching, quality management, next best actions, and outcome measurement.
Customer Service Statistics on Future AI Investments
Customer service statistics on future AI investments show CX budgets concentrating on AI, with 61% of contact center leaders planning higher AI spending (66) while Gartner projects $80 billion in global contact center labor-cost reductions from conversational AI (65). Operational returns remain slower than investment pressure, with 66% of contact centers requiring more than six months to see implementation ROI (68) while 62% of leaders consider successful AI deployment critical to their role (69).
Customer Service Statistics on Future AI Investments
Customer service statistics on future AI investment in 2026
Stat #
Customer Service Statistics on Future AI Investment in 2026
49% of executives call automated QA/QM a top technology investment priority for the next two years, according to the 2026 CMP Research Prism for Automated QA/QM.
Cite source
Nearly 95% of contact center leaders see AI-powered quality solutions as a significant opportunity, according to CMP Research's Emerging Contact Center Technology Market Study.
Cite source
95% of consumers want to know why AI makes the decisions it does, yet only 37% of companies currently offer any reasoning behind AI's decisions.
Cite source
Data protection and cybersecurity are top customer service security priorities for 83% of CX leaders.
Cite source
Future AI and technology investment statistics sourced from Gartner, Verint, CMP Research, Zendesk CX Trends 2026, McKinsey, and Salesforce. For data on current AI adoption and business impact, see Customer Service Statistics on AI Adoption below.
AmplifAI's Analysis on Future AI Investment
Future AI investment decisions center on execution quality rather than purchase intent, with budget growth and strong return potential coexisting alongside long implementation timelines (65, 66, 68, 73). Leadership attention is moving from general AI access toward measurable performance workflows, with automated QA/QM becoming a capital-allocation priority while explanation and security requirements make customer trust part of investment design rather than a post-launch control (67, 70, 74, 75).
Planning future AI investments in 2026 requires organizations and brands to compare the ROI of AI automation versus AI augmentation of human workforces. AmplifAI's guide to the best contact center AI software for 2026 dives deep into AI vendor value across customer automation, agent enablement, leader intelligence, and agentic AI governance, evaluating each vendors workflow coverage, data integration capabilties, and implementation requirements.
Customer Service Statistics on Generative AI Adoption
Customer service statistics on generative AI adoption show software access outpacing workflow maturity, with 88% of contact centers using AI-powered solutions (79) while only 25% have integrated automation into daily workflows (80). Integrated operations already show measurable gains, with AI agents reducing cost per call by 50% while increasing CSAT (81) and AI-resolved service cases moving from 30% in 2025 toward an expected 50% by 2027 (82).
Customer Service Statistics on Generative AI Adoption
Customer service statistics on AI adoption and business impact in 2026
Stat #
Customer Service Statistics on AI Adoption and Business Impact
80% of customer service organizations will integrate generative AI to enhance agent productivity and customer experience, according to Gartner.
Cite source
69% of C-level support executives say customer service roles are evolving because of AI, compared to 34% of frontline agents, while 43% of agents say roles aren't evolving at all.
Cite source
The global AI customer service market is projected at $15.12 billion in 2026, growing at a 25.8% CAGR toward $47.82 billion by 2030.
Cite source
AI adoption and business impact statistics sourced from McKinsey, Gartner, COPC, Salesforce, Call Center Power, and Intercom. For data on customer channel preferences, see Customer Service Statistics on Preferred Channels below.
AmplifAI’s Analysis on Generative AI Adoption
Generative AI adoption becomes meaningful when customer-facing automation, agent enablement, and leadership intelligence connect to daily work, with broad AI usage coexisting alongside limited workflow integration (79, 80). Executive and frontline perceptions remain misaligned, making role-level workflow change and measurable outcomes stronger adoption measures than software presence (81, 83, 84).
Embedding generative AI into customer service and support workflows requires CX leaders to evaluate vendors, define accountability measures, and assign ownership for measuring which AI software delivers the most customer and business value. AmplifAI's best AI-powered call center software comparison guide evaluates vendors across AI automation, agent support, quality management, analytics, workforce integration, role coverage, and outcome measurement within 14 customer service and support categories.
AI Agents in Customer Service Statistics
AI agents in customer service statistics challenge broad workforce-replacement and labor-cost assumptions, with U.S. customer service job postings outpacing overall postings by approximately 10 percentage points year over year (138) while Goldman Sachs estimated daily costs of $92 for an AI call center representative and $90 for a human representative (139). Workforce language also favors augmentation over replacement, with corporate earnings calls mentioning augmentation eight times as often as substitution (140).
U.S. customer service job postings grew approximately 10 percentage points faster year over year than overall job postings after diverging in August 2025.
Cite source
Goldman Sachs estimated an all-in daily cost of $92 for an AI call center representative versus $90 for a human call center representative.
Cite source
AI augmentation receives approximately 8 times as many mentions as AI substitution across corporate earnings calls.
Cite source
AI agent workforce and cost statistics sourced from a16z New Media analysis of Apollo, Indeed, Goldman Sachs, and corporate earnings calls. For adoption and integration data, see Customer Service Statistics on Generative AI Adoption above.
AmplifAI’s Analysis on AI Agents in Customer Service
AI agents are changing the composition of customer service and support centers without reducing employment at the expected scale, with Philippine IT-BPM employment expanding and U.S. customer service job postings outpacing overall postings during accelerated automation adoption (136, 138). Near-equal AI and human representative costs have weakened initial claims of labor arbitrage (139), while AI augmentation language is outnumbering substitution eight to one while supporting that AI agents are changing customer service rather than replacing human agents. AI automation is absorbing repeatable volume leaving human teams to concentrated on judgment, escalation, compliance, relationship management, and service recovery (140).
Customer Service Statistics on Preferred Channels
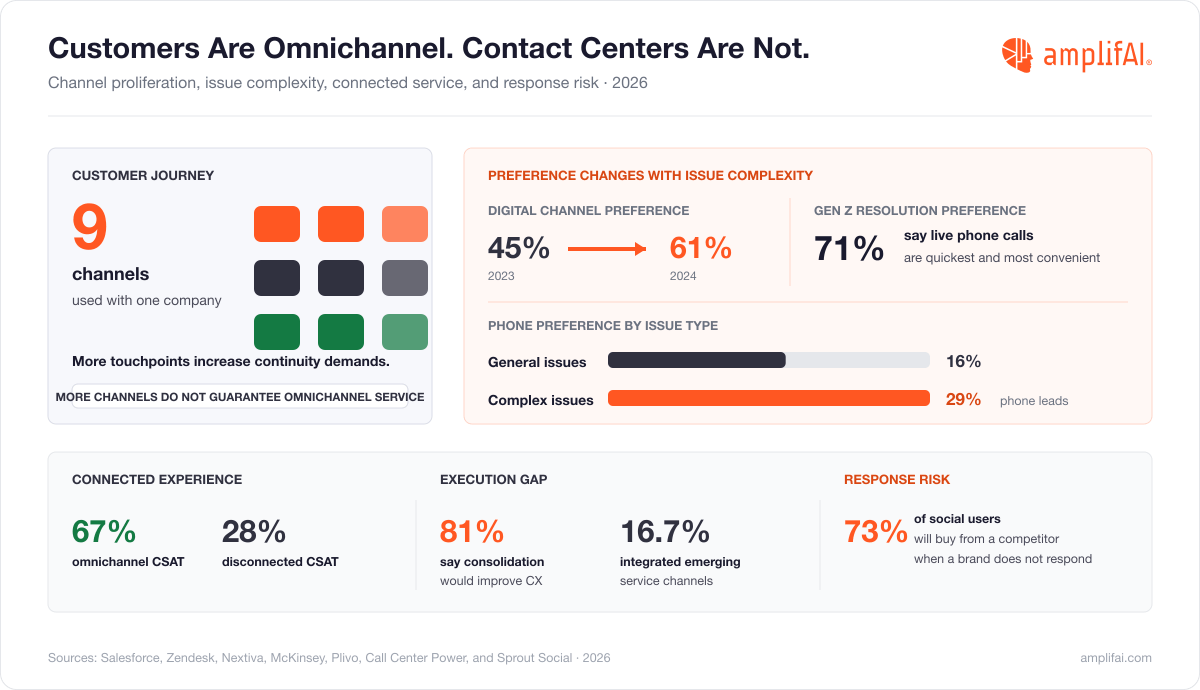
Customer service statistics on preferred channels reveal omnichannel ambition outpacing execution, with customers using an average of 9 channels to engage one company (89) while connected omnichannel service lifts CSAT to 67% compared with 28% for disconnected multichannel setups (93). Channel preference changes with issue complexity, with 61% of customers preferring digital contact (91) while 71% of Gen Z customers consider live phone calls the quickest resolution path (92).
Customer Service Statistics on Preferred Channels
Customer service statistics on preferred channels in 2026
Stat #
Customer Service Statistics on Omnichannel and Communication Preferences
Customers prefer phone calls (16%) and email (16%) for resolving general issues, but phone calls (29%) are the preferred channel for complex issues.
Cite source
4 in 5 brands have implemented channel steering strategies, with 36% successfully deflecting calls to other channels.
Cite source
Channel preference statistics sourced from Salesforce, Zendesk CX Trends 2026, Nextiva, McKinsey, COPC, Sprout Social, Plivo, and Call Center Power. For data on quality assurance across these channels, see Customer Service Statistics on Quality Assurance below.
AmplifAI’s Analysis on Customer Service Channel Preferences
Channel preference follows customer intent rather than age or digital adoption alone, with consumers favoring digital access for general contact while 71% of Gen Z customers choose voice when resolution speed matters (91, 92). Customer journeys spanning nine channels make continuity more valuable than channel count, with connected omnichannel service producing 67% CSAT compared with 28% across disconnected multichannel operations (89, 93). Brand interest in consolidating conversations reflects a measurement problem alongside a routing problem, with fragmented interaction context limiting service quality across channels (94).
Preserving customer context across preferred channels requires conversation analysis that traces voice and text interactions through deployed AI agents and idenitifies where context breaks during handoff to human service teams. AmplifAI's best call center speech analytics software of 2026 comparison guide evaluates vendors across sentiment, intent, topics, root causes, compliance, transcript search, and workflow connection. AmplifAI's best AI agent management software for customer service guide compares how vendors govern deployed AI agents, evaluate handoffs to human teams, and measure performance after corrective actions.
Customer Service Statistics on Call Center Quality Assurance and Management
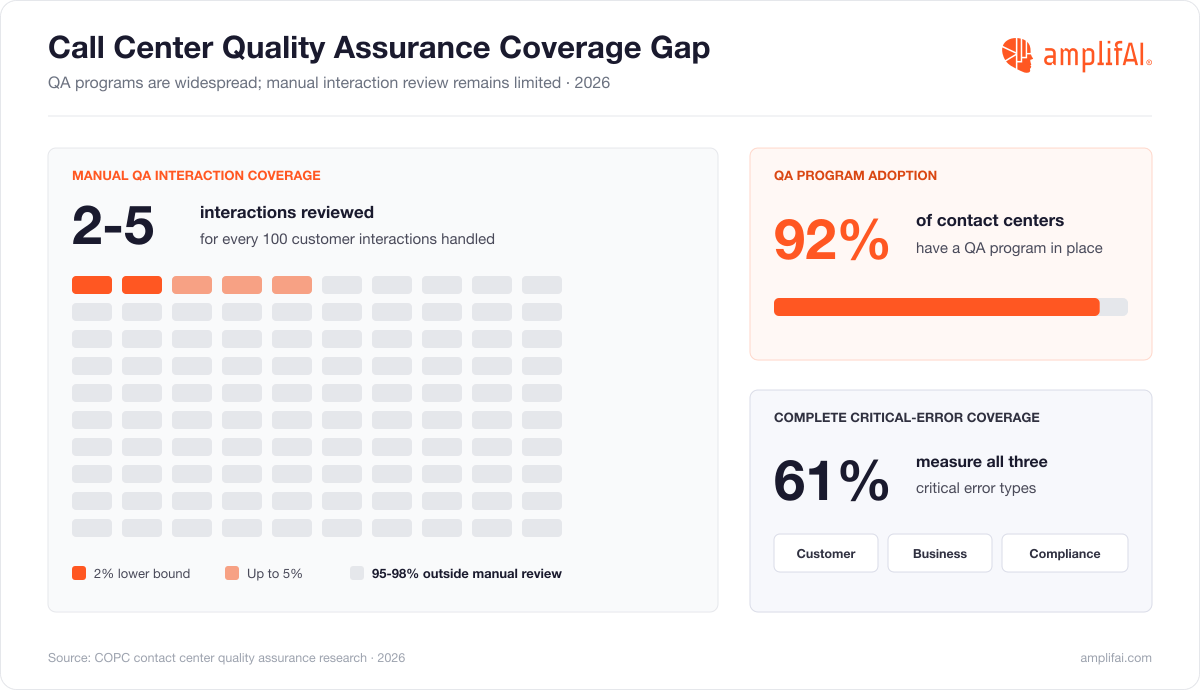
Customer service statistics on quality assurance show program adoption outpacing interaction coverage, with 92% of contact centers operating a QA program (107) while manual review samples only 2-5% of customer interactions (103). Operational constraints deepen coverage limitations, with 85% struggling to find time for quality assurance (104) while only 61% measure all three critical error types (99).
Customer Service Statistics on Call Center Quality Assurance and Management
Customer service statistics on quality assurance and management in 2026
Stat #
Customer Service Statistics on Call Center Quality Assurance and Management
61% of contact centers measure all three critical error types in their QA programs: customer-critical, business-critical, and compliance-critical error accuracy.
Cite source
49% of contact centers rank employee satisfaction as a top five KPI, behind customer satisfaction, response time, and quality assurance scores.
Cite source
Manual QA typically reviews only 2-5% of customer interactions, leaving the remaining 95-98% unmonitored for quality, compliance, and coaching opportunities.
Cite source
92% of contact centers have a QA program in place.
Cite source
Quality assurance statistics sourced from COPC, CMP Research, 8x8, Klaus, and Level AI. For data on call center cost and scale, see Customer Service Statistics for Call Centers below.
AmplifAI’s Analysis on Call Center Quality Assurance and Management
QA adoption without interaction coverage creates program presence rather than quality control, with 92% of contact centers maintaining QA programs while manual and legacy review reaches only 1-5% of conversations (103, 105, 107). Limited sampling narrows call center compliance detection, coaching evidence, critical-error measurement, and customer-experience diagnosis, with 85% of contact centers lacking sufficient QA time and only 61% measuring all three critical error types (99, 104).
Expanding quality assurance coverage across channels requires automated transcription, scoring, and interaction evaluations connected to coaching and performance workflows. AmplifAI's best AI-powered call center quality assurance software of 2026 comparison guide evaluates vendors across Auto QA coverage, scorecards, calibration, compliance, analytics, coaching workflow connection, and measurement of customer service outcomes.
Customer Service Statistics for Call Centers
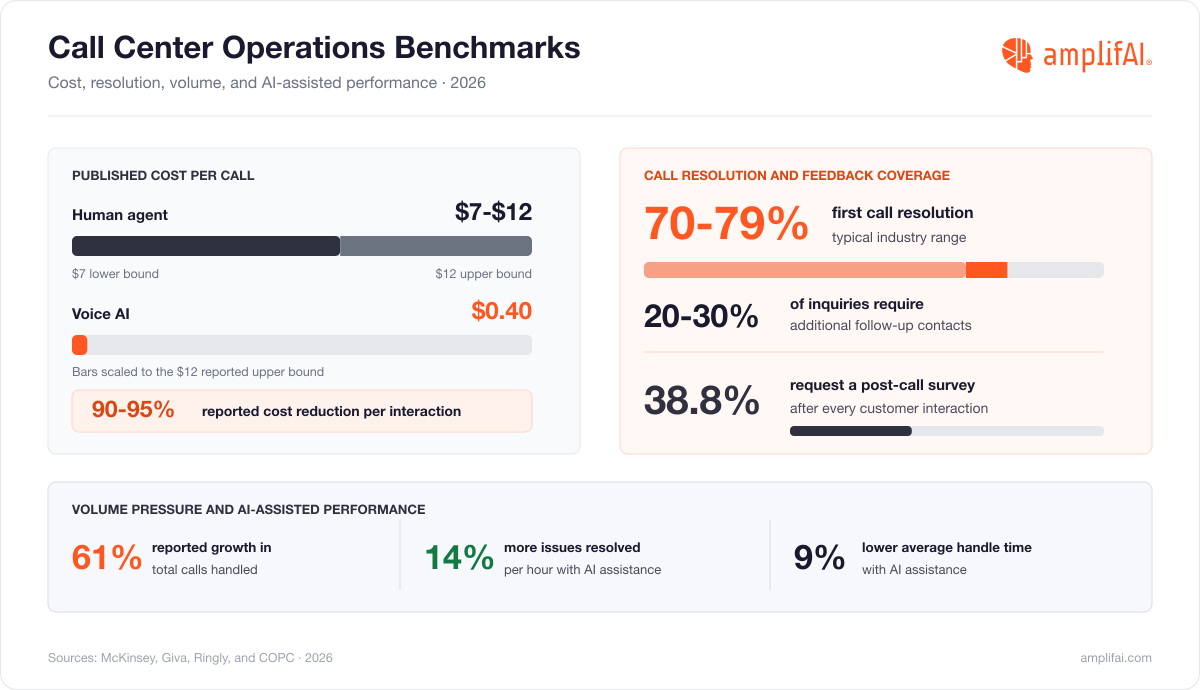
Customer service statistics for call centers show volume and cost pressure converging, with 61% of contact center leaders reporting growth in total calls handled by agents (110) while a published benchmark places human-agent calls at $7 to $12 and Voice AI calls at roughly $0.40 (112). First call resolution rates remain between 70% and 79% (113), leaving 20-30% of inquiries requiring follow-up contacts that compound cost and erode satisfaction.
Customer Service Statistics for Call Centers
Customer service statistics for call centers in 2026
61% of contact center leaders reported growth in the total number of calls handled by agents, driven by expanding customer bases and rising contacts per customer.
Cite source
Call center software was worth over $41.7 billion in 2025, with the global contact center software market forecast to expand at a 21.9% CAGR from 2026 to 2033.
Cite source
Only 38.8% of contact centers ask customers to complete a post-call survey after every interaction.
Cite source
Call center statistics sourced from FCBCO, Statista, McKinsey, Research and Markets, Giva, COPC, and Zoom. For broader CX trends and insights, see Customer Service Statistics: General CX Insights below.
AmplifAI’s Analysis on Call Center Operations
Call center economics change with measurement scope, with a $0.40 Voice AI call appearing materially cheaper than a $7-$12 human-agent call (112) while near-equal all-in daily representative costs weaken the same labor-arbitrage premise at workforce level (139). Rising volume and 70-79% first call resolution make resolution quality the governing variable, with repeat contacts capable of absorbing unit-cost savings before CSAT or retention improves (110, 113). AI-assisted productivity gains require customer-outcome measurement alongside issues resolved per hour and handle time, while post-interaction surveying remains inconsistent (114, 116).
Connecting operating efficiency to customer outcomes requires consistent KPI calculation and comparison against current industry benchmarks. AmplifAI's call center productivity guide provides the formulas and benchmarks you need for FCR, average handle time, CSAT, cost per contact, occupancy, and attrition.
Customer Service Statistics on CX Trends
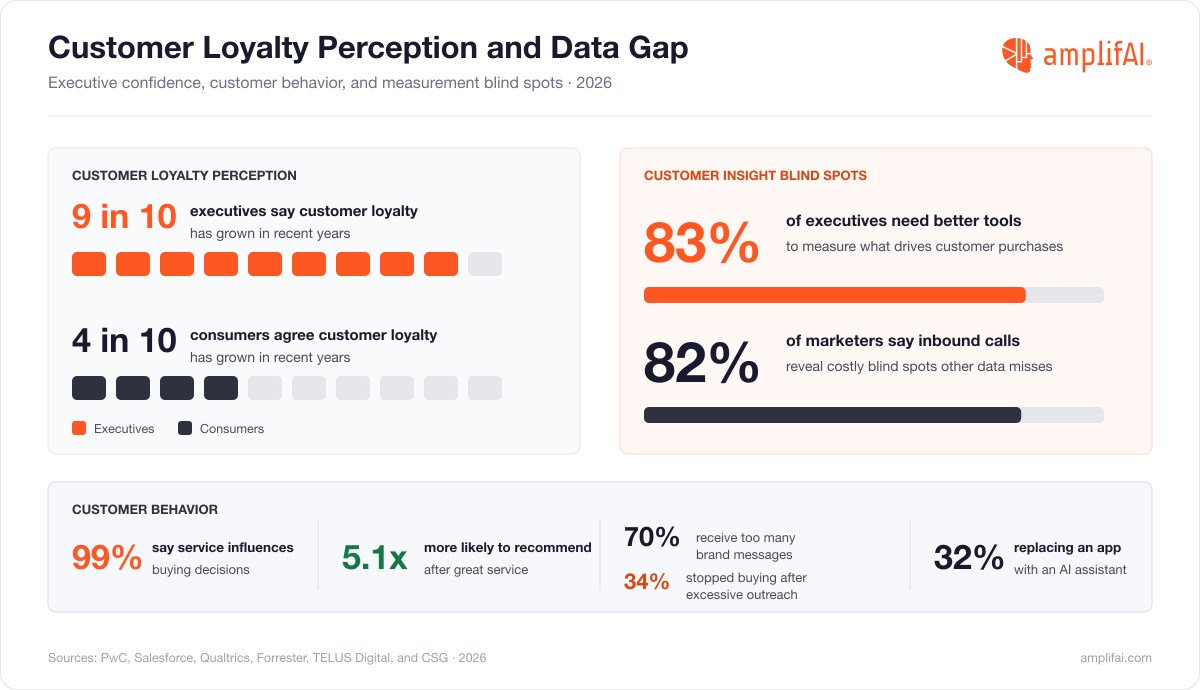
Customer service statistics on CX trends show a widening loyalty measurement gap, with 9 in 10 executives reporting customer loyalty growth while only 4 in 10 consumers agree (118), and 83% of executives acknowledging inadequate purchase-driver measurement tools (119).
The American Customer Satisfaction Index dipped to 76.9 in late 2025, a slight decline that reflects rising expectations outpacing service delivery improvements.
Cite source
Two-thirds of workers use more communication and collaboration tools than two years ago, yet 71% say those tools have made work more complex.
Cite source
70% of consumers say brands send too many messages, and 34% have stopped buying from a company because of excessive outreach.
Cite source
General CX insights statistics sourced from PwC, ACSI, Salesforce, Qualtrics, Coveo, Forrester, TELUS Digital, CSG, and Nasdaq. For data on service recovery and customer loyalty after failures, see Customer Service Statistics on the Service Recovery Paradox below.
AmplifAI’s Analysis on CX Trends
CX measurement fails when executive perception, customer behavior, and frontline evidence remain separate, with loyalty confidence exceeding consumer reality while most executives lack adequate purchase-driver measurement (118, 119). Inbound calls expose customer needs unavailable in other sources even as expanding technology stacks increase frontline complexity, making connected data more valuable than additional software (123, 124). AI assistants and over-communication compress customer attention, with relevance, timing, and context becoming performance requirements across service and marketing interactions (126, 127).
CX leaders need contact center AI that applies connected customer evidence to service automation, agent enablement, and leadership decisions. AmplifAI's best contact center AI software guide compares vendors based on customer automation, agent enablement, conversation intelligence, quality management, coaching, analytics, governance, and outcome measurement.
Customer Service Statistics on the Service Recovery Paradox
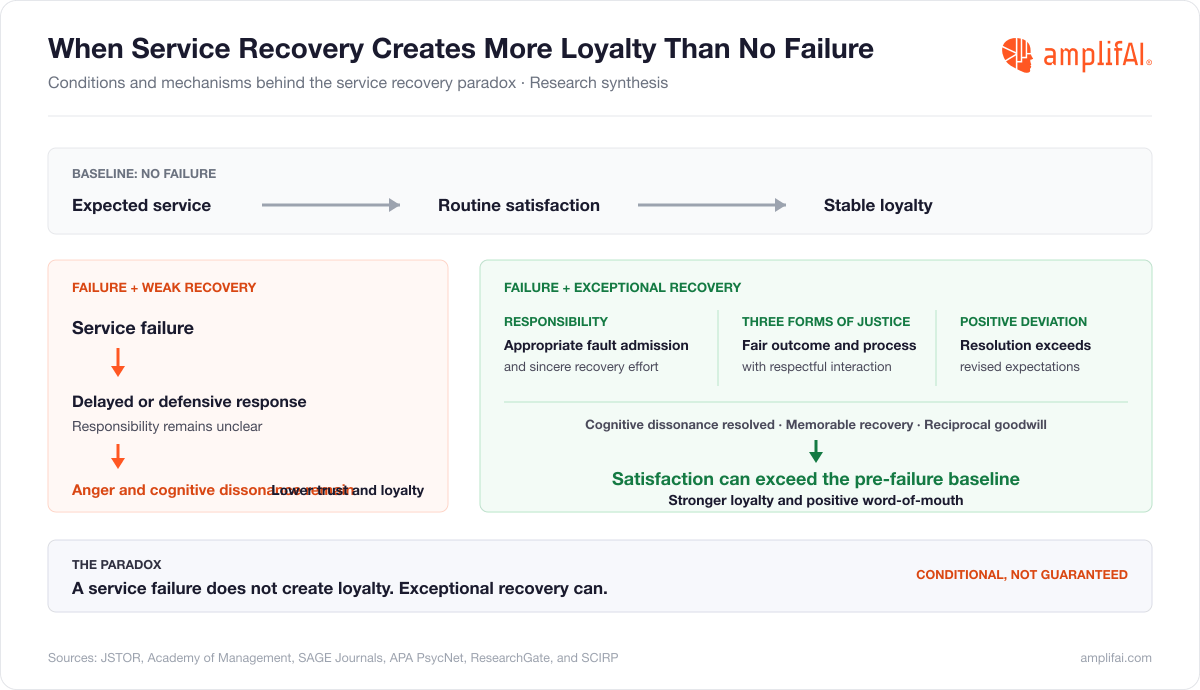
Customer service statistics on the service recovery paradoxshow exceptional recovery producing satisfaction and loyalty above pre-failure levels, with responsibility, fair process, respectful interaction, and positive deviation shaping customer trust. Service recovery strength depends on revised expectations, with memorable resolution creating reciprocal goodwill and positive word-of-mouth.
Customer Service Statistics on the Service Recovery Paradox
Customer service statistics on the service recovery paradox in 2026
Stat #
Customer Service Statistics on the Service Recovery Paradox
Customers who attribute a service failure to something beyond the company's control and see sincere efforts to fix it are more likely to respond positively to recovery attempts.
Cite source
Service recovery efforts that positively deviate from what customers expect can lead to increased satisfaction and loyalty beyond pre-failure levels.
Cite source
Companies that admit fault and take responsibility can alleviate customer anger and trigger reciprocal goodwill, leading to higher satisfaction when followed by effective recovery.
Cite source
All three types of justice (distributive, procedural, and interactional) significantly influence customer satisfaction and trust after a service recovery effort.
Cite source
Service recovery that exceeds a customer's revised expectations can produce higher satisfaction than if no failure had occurred in the first place.
Cite source
Effective service recovery resolves the cognitive dissonance caused by a service failure, reinforcing the customer's positive view of the company and strengthening loyalty.
Cite source
Exceptional and unexpected service recovery creates a memorable positive experience that stands out more than routine good service in the customer's memory.
Cite source
Customers who receive recovery that goes above and beyond often feel compelled to reciprocate with increased loyalty and positive word-of-mouth.
Cite source
Service recovery paradox research sourced from JSTOR, Academy of Management, SAGE Journals, APA PsycNet, ResearchGate, and SCIRP. For a deeper analysis of how service recovery drives loyalty, see our full guide on the service recovery paradox.
AmplifAI’s Analysis on the Service Recovery Paradox
The service recovery paradox doesn't turn failure into a customer-experience strategy, as post-failure loyalty depends on customer attribution, sincere recovery effort, company responsibility, and resolution exceeding revised expectations (128-132). Exceptional service recovery becomes memorable when distributive, procedural, and interactional justice align, with fair outcomes, fair processes, and respectful treatment converting cognitive dissonance into trust, reciprocal goodwill, loyalty, and positive word-of-mouth (131, 133-135).
Executing service recovery consistently requires frontline coaching tied to failure context, customer emotion, policy judgment, ownership, and recovery outcomes. AmplifAI's best AI-powered call center coaching software of 2026 comparison guide evaluates how vendors turn interaction evidence into coaching priorities, deliver coaching through accountable workflows, and measure changes in agent behavior and performance.
Customer Service Statistics and Benchmarking Research
AmplifAI publishes proprietary customer service and support research, original analysis, and industry benchmarks alongiside collaborative research with CMP Research, publicly available findings from Gartner®, and published data frmo Forrester® and McKinsey & Company. Research spans AI adoption, workforce engagement, productivity formulas, customer experience benchmarks, and analytics methods for measuring contact center performance.
Customer Service Statistics and Benchmarking Research Directory
Research Guide
Research Type
What It Covers
Customer Service Statistics
Category statistics
140 sourced statistics covering customer expectations, customer experience, agents, AI, channels, quality assurance, call centers, and service recovery
Analytics types, data sources, root-cause analysis, performance actions, and outcome measurement
Customer Service and Support Software
Customer service and support software spans the capabilities CX teams use to analyze interactions, evaluate quality, coach agents, manage performance, oversee AI agents, and understand customer behavior. AmplifAI’s call center software buyer’s guides compare vendors and features across each category, showing which capabilities measure performance against the benchmarks in this report and move findings into action.
Richard James researches, reviews, and evaluates contact center software to help CX leaders make better technology decisions. His work focuses on what contact center teams need from their software, which problems buyers are trying to solve, and whether vendors can support those needs in real-world environments.
Richard’s buyer guides go beyond feature lists, comparing how contact center and customer service software supports quality assurance, coaching, performance management, analytics, customer insights, and AI-driven workflows. With 7+ years deeply embedded in the CX and contact center software market, Richard understands the decisions operators face, capabilities that matter, and differences between vendors that are easy to miss during evaluation. Richard believes buyers deserve honest, thorough research that respects their time and helps them ask better questions before choosing software.
Sean Minter founded AmplifAI after spending 25+ years building, running, and turning around contact center businesses. Before AmplifAI, Diamond Castle Holdings, a $4B private equity fund, brought Sean in as President and COO of PRC, a global BPO with more than 10,000 contact center agents and $300M+ in annual revenue. Sean led PRC’s turnaround and eventual acquisition by Alorica. Running contact center operations at scale exposed the gaps existing software could not close. Sean founded AmplifAI to solve those problems, building an end-to-end contact center performance system that unifies data from every source into a single AI-ready layer, delivering actions to every level of the organization from agents to VPs.
Sean is a serial entrepreneur who has founded four technology companies, including Reallinx, a managed network and security provider later acquired by GTT. Sean was named an Ernst & Young Entrepreneur of the Year Southwest Award finalist in consecutive years, and AmplifAI has been recognized on the Inc. 5000 list of fastest-growing private companies. Sean holds an MBA from Southern Methodist University and a BS in Electrical Engineering from Ohio State.




.svg)
